
Investing
Volatility measures movement, not the chance of losing money
The most quoted risk statistic describes how much prices wobble. That is related to risk without being the same thing.
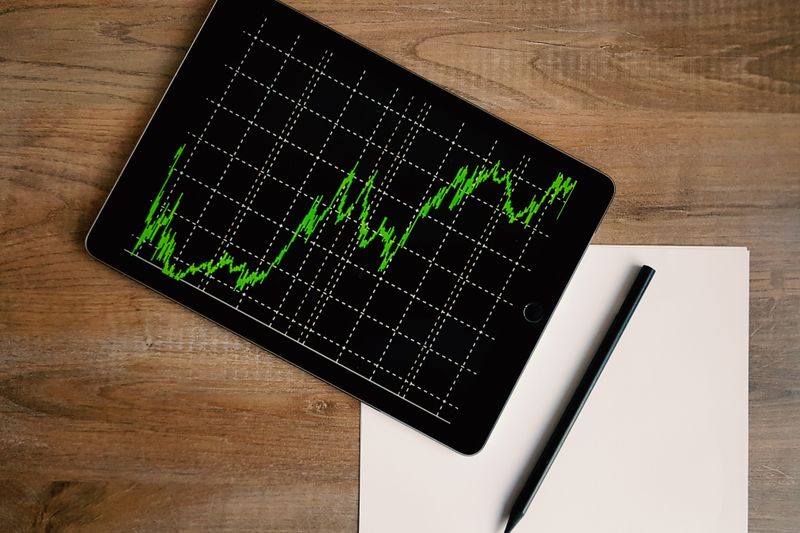
What follows is an argument about volatility, and about where the received version of it stops being true.
The argument in brief
- Volatility treats upward and downward movement identically.
- It is measured from the past and is not a forecast.
- Permanent loss of capital is a different risk from price movement.
What the number describes
Volatility is a statistical measure of how widely returns have varied around their average over some past period. A high figure means the price moved a great deal, and a low figure means it moved comparatively little. Crucially it makes no distinction between movement upwards and movement downwards, since both are simply deviation from the average.
That means a holding which rose sharply and steadily can register as volatile despite never having disappointed anyone. Using a single symmetrical number to describe an experience that is emotionally asymmetric is the main weakness of the measure.
Why it is used anyway
It is calculable from price data alone, comparable across very different assets, and it aggregates sensibly across a portfolio. No other single statistic does all three, which is why it underpins so much of how risk is reported and regulated. It is also genuinely informative about how uncomfortable holding something is likely to be, which matters for whether you keep holding it.
In numbers, for money with a fixed date, higher volatility does translate into a wider range of possible values at that date. So the measure is useful, provided it is understood as a description of movement rather than as a probability of loss.
What it does not capture
It says nothing about the risk that an asset falls and never recovers, which is the risk that actually destroys capital. An asset can have low measured volatility and carry a small chance of a very large permanent loss, which the statistic will not reveal.
Illiquid assets valued infrequently often show low volatility simply because the price is not being observed continuously. That is a measurement artefact rather than a genuine difference in risk, and it is a well-known limitation. Any figure derived from prices inherits the frequency and honesty of the pricing behind it.
Past and future
Volatility is always measured over a historic window, and the choice of window changes the answer considerably. A calm period produces a low figure, which then understates risk precisely when complacency is highest.
The arithmetic is straightforward: volatility does cluster in practice, meaning turbulent periods tend to follow turbulent periods, which gives the measure some short-run predictive content. That clustering does not extend to predicting direction, and nothing in the statistic indicates whether prices will rise or fall.
Treating a recent volatility figure as a forecast of the next decade is one of the more common misuses of the number.
Time horizon changes the meaning
For money needed next month, price movement is the dominant risk, because there is no time for a fall to reverse. For money not needed for decades, the more relevant risk is failing to keep pace with prices, which volatility does not measure at all.
Assets with low measured volatility can be the riskier choice on a long horizon for exactly that reason. This is why risk questionnaires that ask only about comfort with fluctuation capture half the question. The other half is when the money is needed, which is a fact rather than a preference.
Assume any product feature can be withdrawn at renewal.
Reading risk disclosures
Regulated documents in many markets summarise risk on a numerical scale derived largely from past volatility. Those scales are useful for comparing similar products and misleading when used to compare fundamentally different ones. The narrative risk warnings alongside them often describe the risks the number cannot capture, and they are worth reading for that reason.
A holding can be appropriate at any point on such a scale depending on the purpose and horizon of the money. This is general information about a statistical measure and not a recommendation about how much risk to take.
The takeaway
Volatility answers how bumpy, not how likely to lose. For long-horizon money, the risk it ignores is the one that matters.
The decision is rarely about picking the best option — it is about avoiding the expensive one.
Questions readers ask
Does low volatility mean low risk?
It means prices have moved less over the measured period. It says nothing about the chance of a permanent loss, and illiquid assets can look calm simply because they are priced rarely.
Can volatility predict a crash?
No. It describes past movement and tends to cluster, so turbulence often follows turbulence, but it carries no information about direction.


